Data visualization
We provide a toolbox full of useful postprocessing modules ready to use online. Whether it is for your own simulations or on the monitoring platform, these tools will allow you to dig further into the data allowing you to extract valuable information.
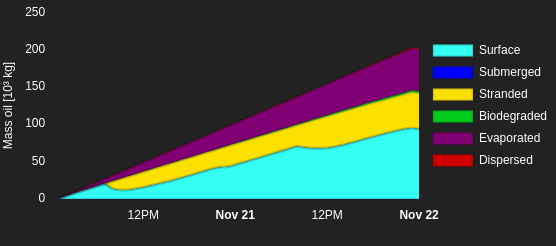
Both the modeling and monitoring platforms are equipped with a number of postprocessing tools that allow you to easily visualize, compare and use your simulation outputs. You can extract timeseries of all the model outputs and compare them with observations at hundreds of measurement stations accessible through the platform. You can also use the currents and waves to simulate the transport of drifting objects and substances such as oil spills, sediment plumes or plastic debris.
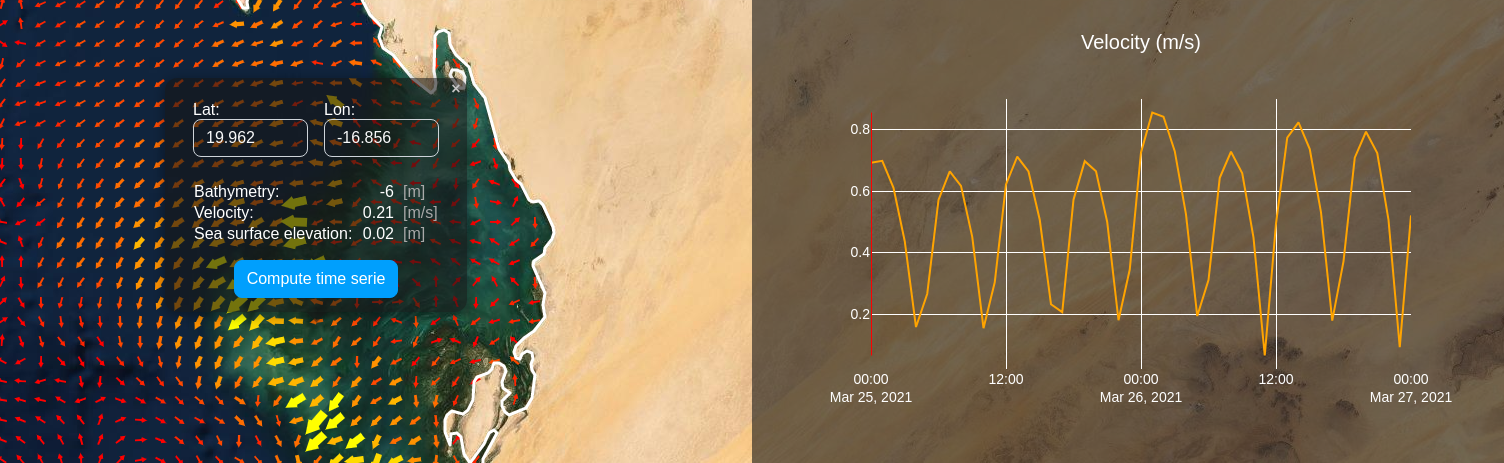
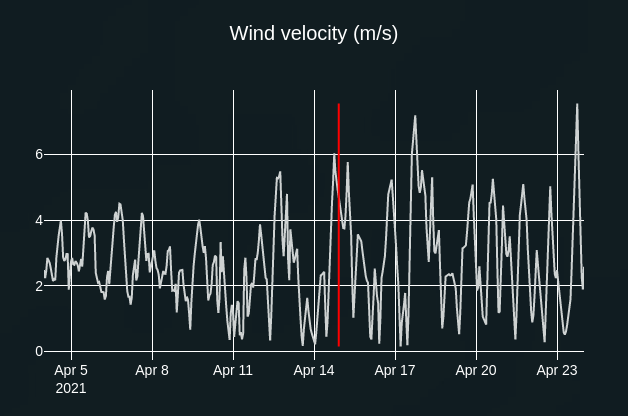
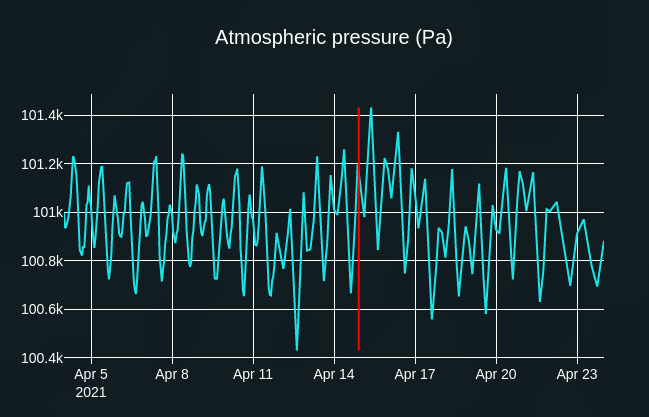
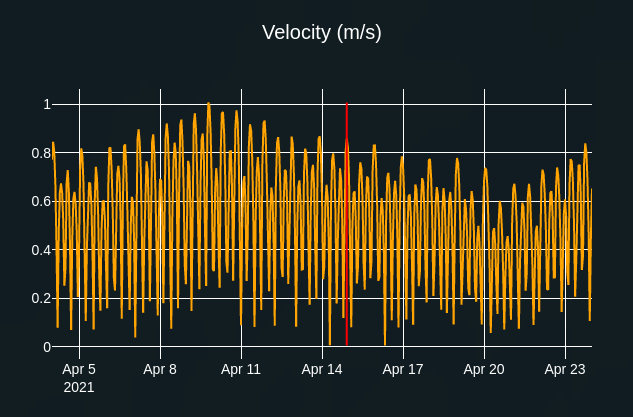
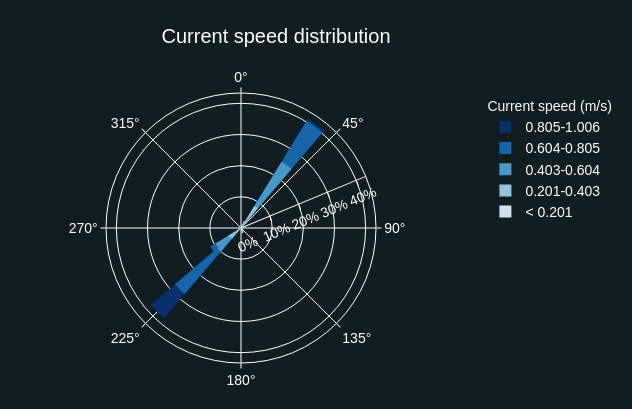
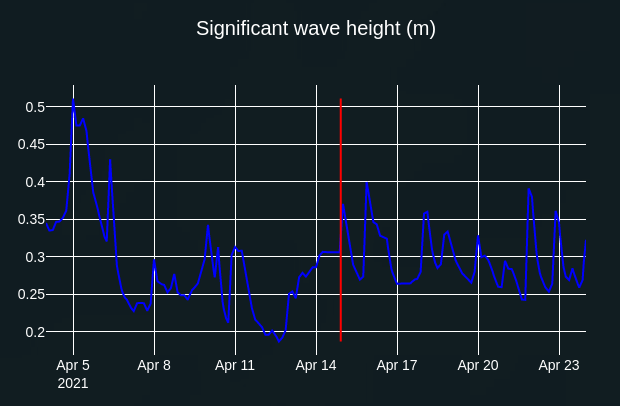
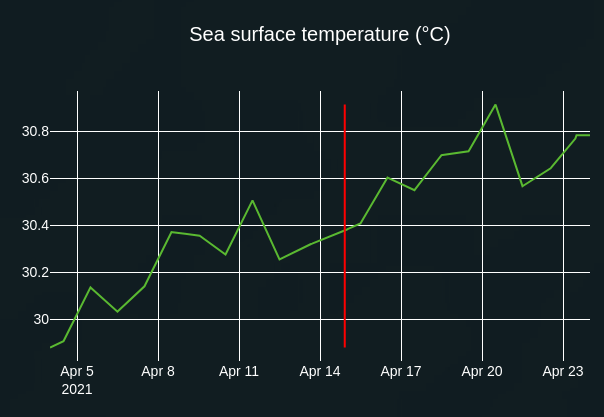
Study the evolution of variables over time on a specific location
Our platform allows you to seamlessly view the temporal evolution of outputs over the study area. Click anywhere on the map to compute timeseries for all available variables on that location. Navigate through the graph and display your data for any chosen time steps. The timeseries data can then be downloaded for further data analysis if needed.
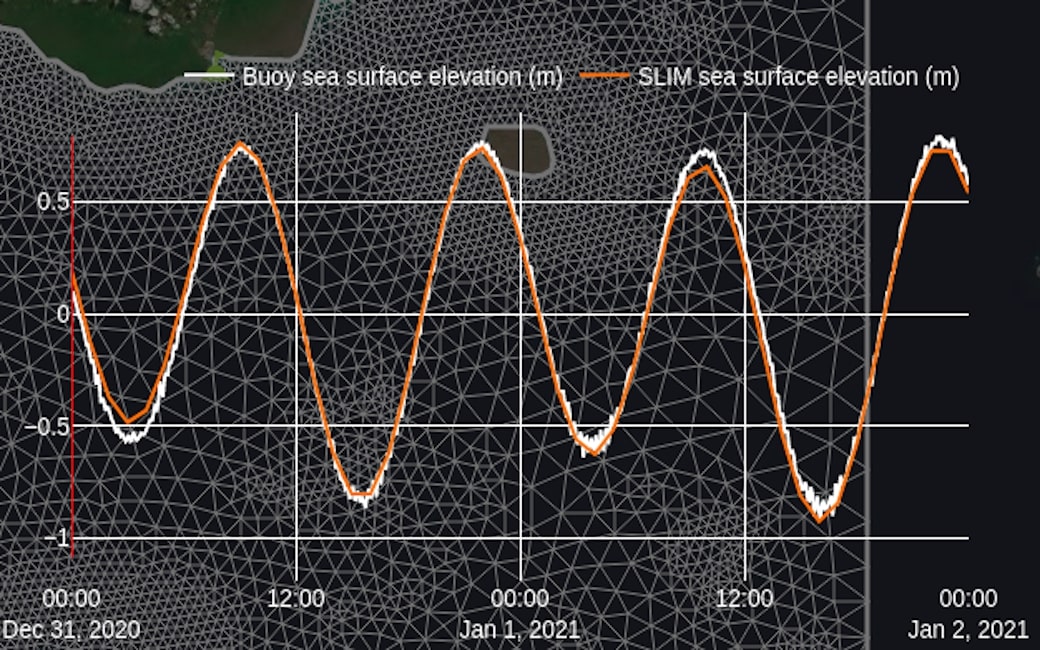
Compare model outputs with buoy observations.
We provide up-to-date data from buoys spread around the globe. When buoys are available in your domain, the measured sea surface elevation signal is plotted along with the sea surface elevation predicted by our model. This provides an easy-to-use source for validating your simulation.
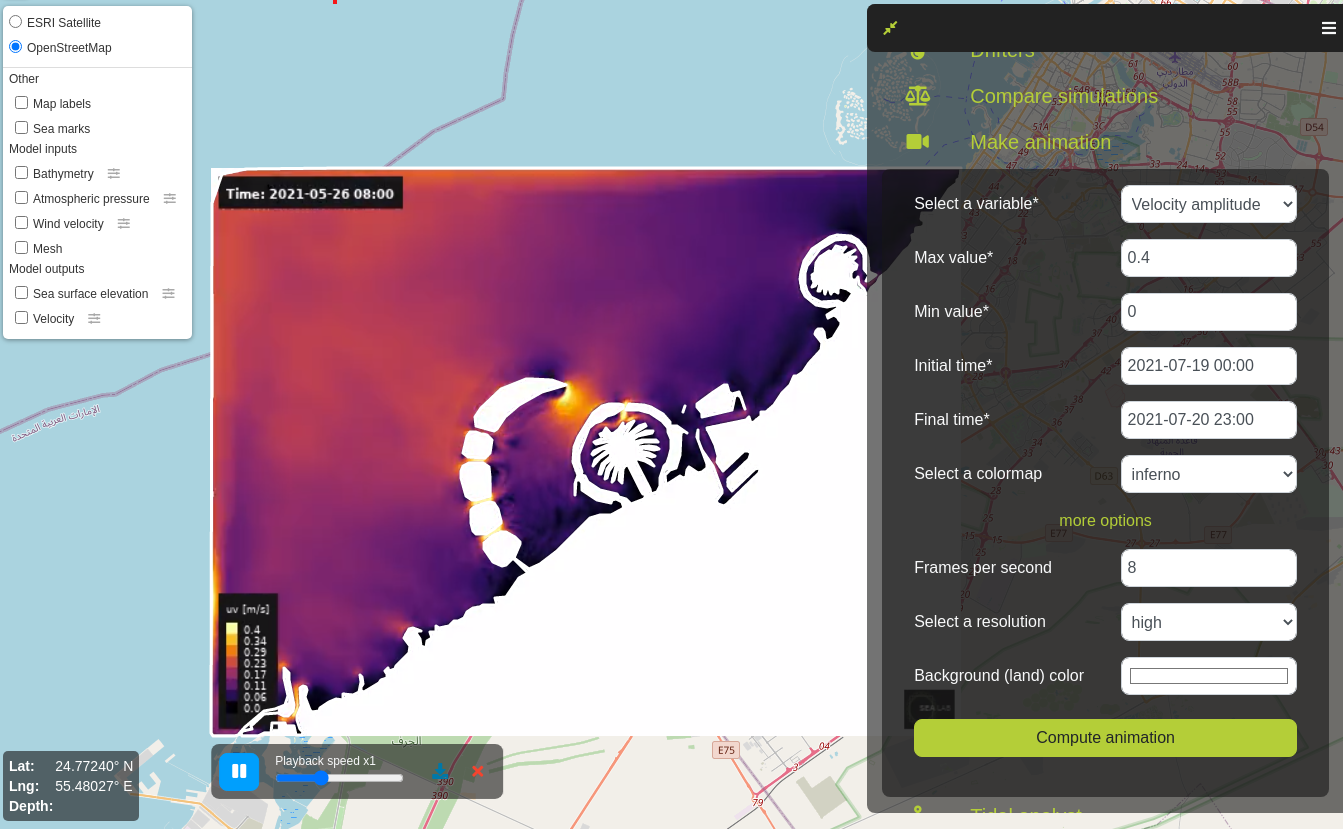
Create and export video animations.
The animation tool allows you to quickly generate customized videos. These videos can then be viewed directly on the map and downloaded.