Oil drift model
Oil spills are a real threat for the environment and for human activities such as fish farming or sea tourism. Dealing with such pollution is costly, time consuming, and complicated, especially once the oil has reached the coastline.
At SeaLab, we rely on numerical modeling to predict the path of oil spills. Being able to predict the expected path of a spill allows to deal with it before it reaches the shore or critical infrastructures such as desalination plants or fish farms. You want to identify the culprit of a leak impacting your region? Backtracking is made for you! Backtracking is a method that reverses time in order to reconstruct the past trajectory of a spill and indentify its possible source.
Launch your oil spill simulation within minutes.
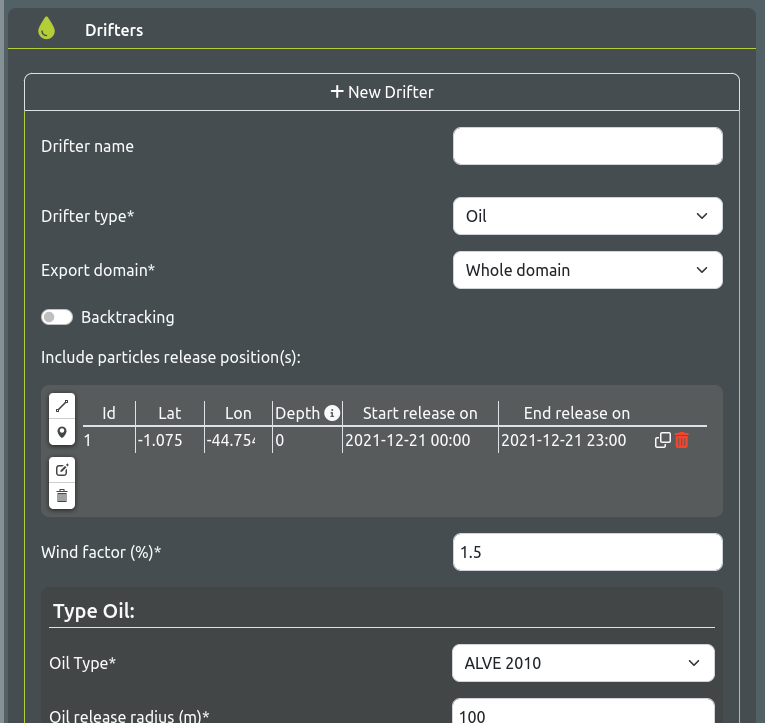
We use Openoil, a module of OpenDrift, to simulate the spread of oil spills in the marine environment. The model is forced by the hydrodynamic results from the Modeling or Monitoring platforms. Beside the sea currents driving the trajectory, the evolution of the oil spill is determined by turbulent mixing and weathering processes. Simulation results provide you quick estimates on the probable impacted areas and the timings of these events. The evolution of the spill is also detailed between phases (evaporated, stranded, ...). Multiple simulations can be launched in order to compare different spread scenarios. It is also possible to use the Drifter tool to run backtracking simulations in order to go back in time and find the origin of the spill.
Set up and run the simulation.
Set the starting positions or upload the shapefile of a spill area. This can be the position of the leak or the shape of the current spill. Then, configure the type of discharge (continuous or punctual).
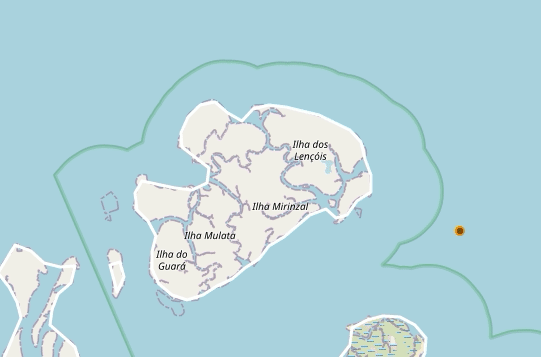
Visualize the spread through time.
Results are obtained within minutes and can be viewed directly on the map. Navigate through time and check out the path of the spill.
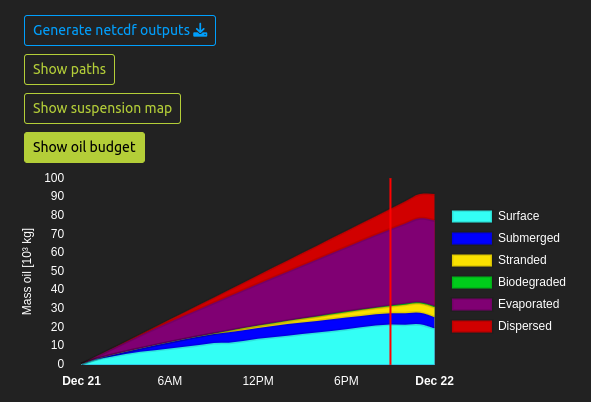
Check out the oil budjet evolution
The evolution and the distribution of the oil mass is detailed on the oil budget graph.